
savefig()メソッド で現在の図を保存する。
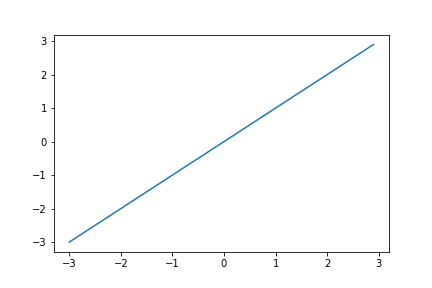
〇一次関数のグラフ
import numpy as np
import matplotlib.pyplot as plt

x = np.arange(-3, 3, 0.1)
y = x

plt.plot(x, y)
plt.savefig("graph1.png")
plt.show()
graph1.png
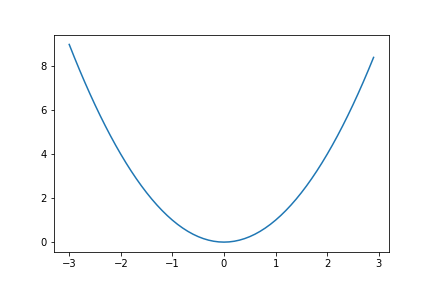
〇二次関数のグラフ
import numpy as np
import matplotlib.pyplot as plt

x = np.arange(-3, 3, 0.1)
y = x * x

plt.plot(x, y)
plt.savefig("graph2.png")
plt.show()
graph2.png
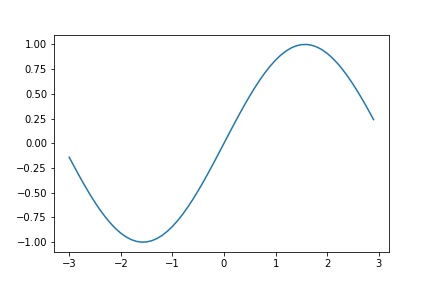
〇三角関数(正弦波)のグラフ
import numpy as np
import matplotlib.pyplot as plt

x = np.arange(-3, 3, 0.1)
y = np.sin(x)

plt.plot(x, y)
plt.savefig("graph3.png")
plt.show()
graph3.png
☆Tips
savefig()メソッドは show()メソッド の前、plot()メソッド の後に記述する。